
¡HI! If you want to propose us a project, send a mail to info@albatian.com


ALL INFORMATION ABOUT
BPM, PROCESS, R & D, TECHNOLOGY
The reporting on Cibersegurity is meant for management satisfation or to progress?
By Bernardo Ramos, IT security expert

What is the use of reporting in general?
There are three possible answers:
- To satisfy the boss's craving for information
- To show that you do your job
- To identify what needs to change to make progress.
Of course, everyone will say that the third option is the correct one
But in most cases the true answer is the first one without any further aim
If we want to know if we are doing well in terms of cybersecurity, if we really want to use reporting to identify things we need to change in order to progress, then we should build our dashboards to answer three questions:
- Are our users respecting the security rules we have defined?
- Are appropriate the security rules we have defined?
- What has really happened?
Depending on the answers, we will be able to identify the necessary actions
- Change the rules
- Adapt control measures in order to improve the respect of defined rules
- Make a thorough rethinking.
How do we structure our scorecards on cybersecurity?
Our reporting should consist of three dashboards, each of which should answer one of the questions listed above.
Each scorecards should have several indicators representative of the risks that threaten our entity
Automation of the calculation of our indicators is a key success factor for truly effective reporting as it will guarantee that they are measured in a permanent and sustained manner.
For each indicator we will identify several reference values:
- Threshold: the value that would normally be obtained with existing mechanisms
- Objective: Value that would be an improvement and would be feasible to achieve if a specific action plan is put in place
- Minimum: Minimum acceptable value
Here is an example of a reporting system as described above:
Example of Cibersegurity Dashboard
The Cybersecurity Scorecard that we present is structured in 3 axes to answer three different questions.
The answers to these questions will give us a diagnosis of our situation and will allow us to identify the actions needed to progress in the protection of our informational assets:
- Vulnerability: Are the rules we have defined appropriate to our environment and our needs?
- Compliance: Are we respecting the rules we have defined?
- Reliability: What has been the result in reality?
Here are some examples of indicators that could be used in our dashboard. In practice, the choice of indicators will depend on two criteria:
- What metrics are significant for my entity’s activity?
- What indicators can I easily measure with the means I have?
In our example, to answer the first question (Vulnerability) we propose the following eight indicators:
- Changes in our IT infrastructure (number of changes, as for ITIL sense of the term, weighted by a coefficient depending on the scope of each change)
- Changes in our business applications, ERP, etc. (With the same criteria as the first indicator)
- Changes in other applications, support applications, technical applications, etc. (Using the same criteria as the first indicator)
- Changes in the perimeter of our company or entity (mergers, cessions, acquisitions, opening or closing of sites, delegations, etc. Organizational changes ...)
- % SPAM and malicious mail
- Number of viruses detected
- Network incidents that triggered the backup mechanisms provided
- Number of missing devices (losses or thefts of PC, smartphones, etc.)
To answer the second question (Compliance), we propose the following nine indicators:
- Average strength of passwords used (in the Windows environment, for example)
- Number of users with local admin privileges on their PCs
- % of DRP Tests performed compared to planned
- % PC with antivirus without updating
- % PC without security updates applied
- Number of PCs containing unauthorized or dangerous programs
- Number of sites that have not successfully passed the certification of Compliance to connect to the corporate network
- % servers with known vulnerabilities
- Number of laptops detected without the anti-theft security cable
To answer the third question (Reliability) we propose the following eleven indicators:
- Number of alarms sent by the security event monitoring system (SIEM)
- Number of events detected by the security event monitoring system (SIEM)
- Number of Information Technology security incidents
- Number of network incidents with service interruption
- Number of virus infections
- % network availability for vital workplaces (maximum requirement level)
- % network availability for critical workplaces (second requirement level)
- % of network availability for all centers
- % availability of vital applications (maximum level of demand)
- % critical applications availability (second requirement level)
In order to obtain a graphical representation, we will express each indicator with a value that can vary between 0 and 2.
The value 1 represents the "Threshold" (what we should get when everything works correctly with the existing resources)
A value less than 1 shows a positive performance
A value greater than 1 shows a malfunction in cybersecurity that requires our attention.
We will also define an "Objective" value, which corresponds to what we would like to achieve when we want to do better than the "Threshold". This will require, in general, to do something different, to use additional resources and to take actions that allow us to improve.
Figure 1 (IT Security Scorecard) is a synthesis of the consolidation of indicators for the three axes. There will be one column per quarter for each axis.
To simplify the reading of graphs, we have only recorded values for the first quarter

In this example, we can verify the following:
- Regarding Vulnerability, there have been no significant changes in our environment that require a change in the current security rules.
- With respect to Compliance, we find that there is a problem in respecting the defined rules. We must analyze the detail of the scorecard relative to this criterion to define the necessary corrective actions.
- Finally, with respect to reliability, we find that, in reality, we have obtained a result in terms of cybersecurity close to what we consider normal, so we would not need, in principle, to go deeper.
Figure 2 (Vulnerability Analysis) shows the detail of the indicators corresponding to the criterion "vulnerability"

Figure 3 (Compliance Analysis) shows the detail of the indicators corresponding to the Compliance criterion.
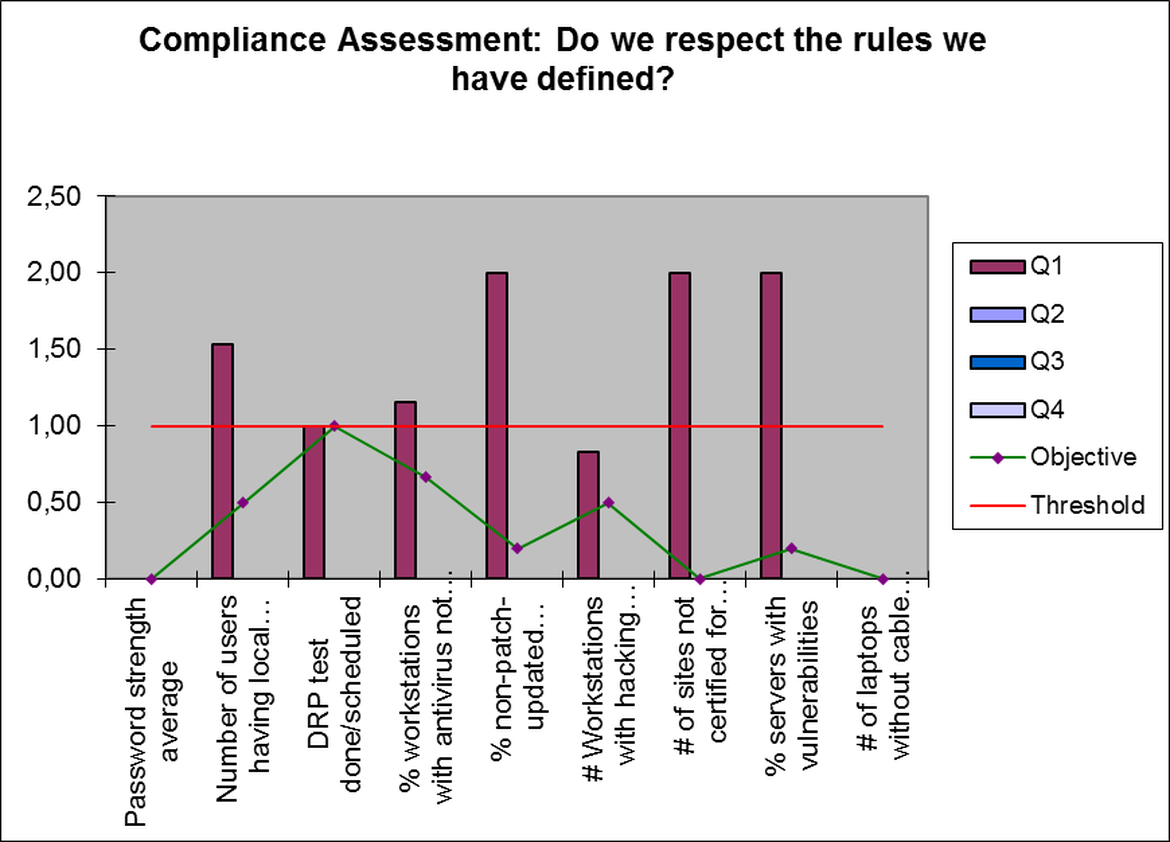
We noticed a problem with the indicators "Users with local admin", "Security updates" "Uncertified sites" and "Servers with vulnerabilities".
From this information, we can define the corresponding action plans to correct the anomalies.
Finally, figure 4 (Reliability Analysis) contains the details of the indicators corresponding to the criterion "reliability"
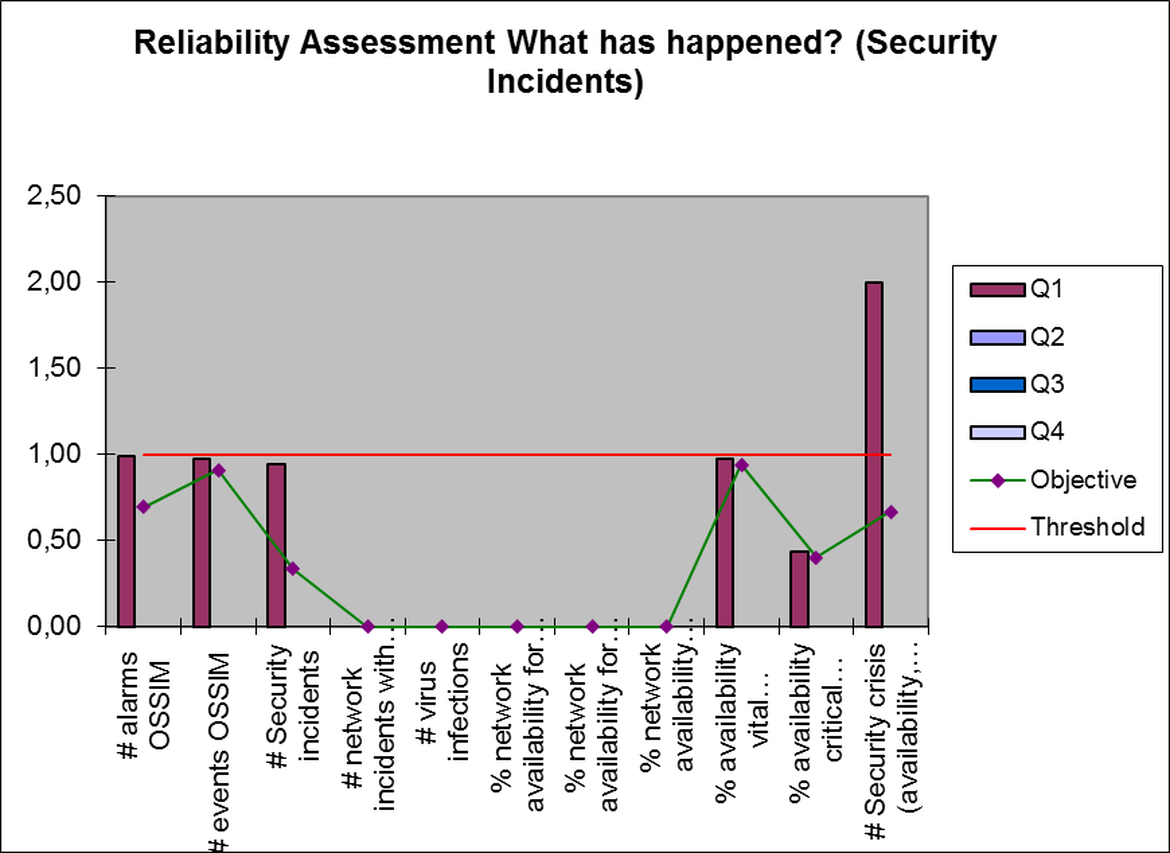
The only indicator to monitor would be the number of security crises formally activated during the period. An analysis of them will tell us if we have to act and in what sense.
The reporting experience in Cibersegurity in real life
What we describe above looks beautiful and with it, in theory, we would have a magnificent monitoring system that would give us an accurate picture of our situation regarding cybersecurity and alert us promptly when it would be necessary to take additional measures to keep our information assets properly protected.
But reality is more prosaic:
- Bosses want to feel secure and at the same time not spend more money
- Most stakeholders want their system to function but do not want to have complications or feel monitored or devote resources to obtaining indicators.
- In the absence of serious incidents, everyone prefers to look away for comfort.
- In the event of a serious incident, the entire focus will be placed on the incident in question and excessive action will be taken to have the sensation of avoiding similar incidents in the future
In short, the rigorous reporting on cybersecurity is uncomfortable for most of the actors involved and we need still many years before we generate a culture that leads to it.
RELACIONADO
-
Agile, the last trend in information technology
by Albatian Feb. 19, 2017
-
Cybersecurity: Do not Protect Your PC
by 4 May 9, 2017
-
Cybersecurity
by Albatian Jan. 10, 2017
-
How ciber security providers look like neighborhood thugs?
by Albatian Nov. 14, 2016
-
Payback of management misinformed by excess - PCs in the industrial environment
by 4 July 9, 2017
-
The whole truth about safety
by 4 Sept. 18, 2017
-
The ROI (Return On Investment) in Compliance Programs
by 4 Jan. 7, 2020